Benchmarks
Benchmarks are calibrated against the same cohort math Sentia uses inside the product. A green number here means above peers.
EMV
EMV Cost Benchmarks
Per-engagement EMV costs from two methodologies: public consensus and first-party portfolio. Updated monthly.
Read more

Benchmark
Italy's Education Lead Gen on Facebook: 6,635 Ads, €1.86 Median, 130 Accounts per Brand
Italy's education lead-gen cohort on Facebook is 6,635 ads across 1,953 accounts for just 15 brands. Median ad spends €1.86 and reaches 480 people. The market is a micro-testing economy, not a scaling economy.
Read more
Benchmark
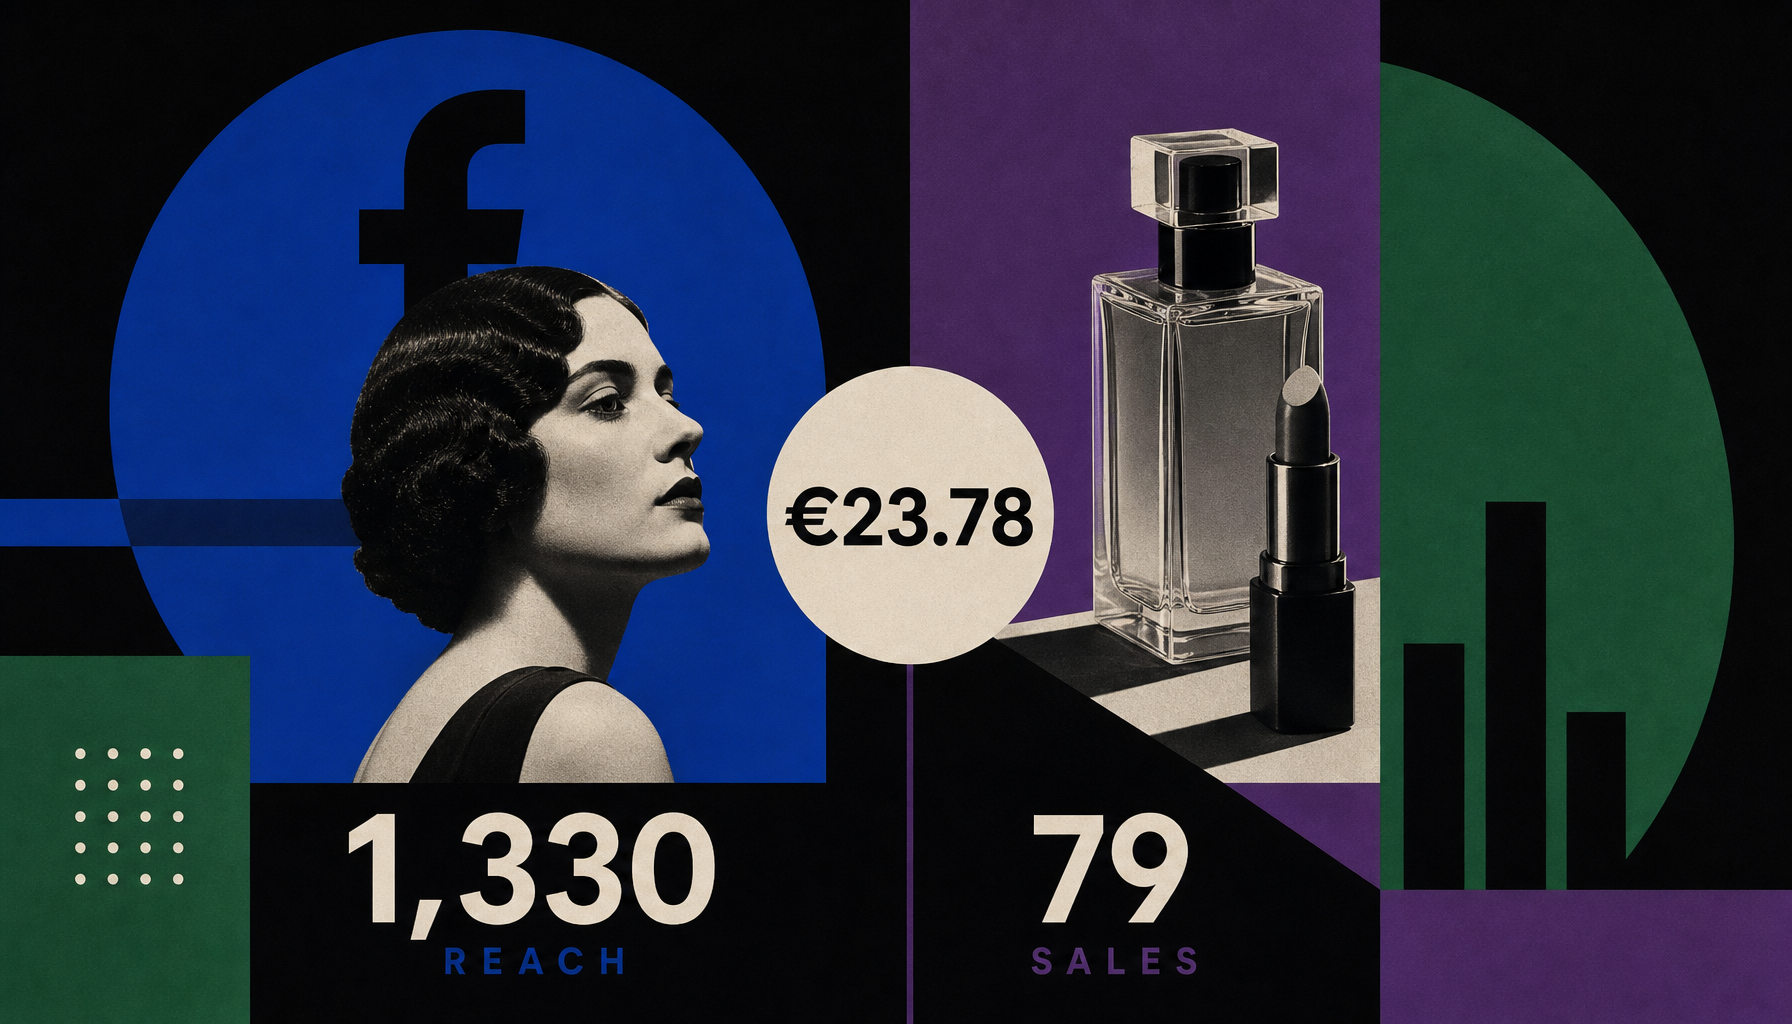
Italy Beauty's Facebook Split: The Same €23.78 Buys 1,330 Reach in Awareness and 79 in Sales
Italy's beauty brands ran 3,819 Facebook sales ads with a median EU reach of 79 people, while awareness ads reached 1,330 at the identical €23.78 median spend. A 16.8x gap hides in the objective dropdown.
Read more

Benchmark
Italy's €9.6M YouTube Retail Sales Cohort Is One Brand Running 1,618 Text Ads With Zero Recorded Reach
Italy's 90-day YouTube sales cohort for retail marketplaces is a single brand: 1,618 text ads, €9.58M in spend, a €19-wide spend shelf, and zero recorded daily reach across every ad.
Read more

Benchmark
Italy's Gaming Lead Gen on Facebook Is a Ghost Fleet: 86 Accounts, 4 Brands, €453 in 90 Days
Italy's gaming lead-gen vertical on Facebook shows 262 active ads, but they spent a combined €453 in 90 days across 86 ad accounts and just 4 brands. Here is how to read a ghost fleet.
Read more

Benchmark
The Floor Is Fine, the Ceiling Is 4.6x Away: Italy's Electronics Brands on YouTube Organic
A small slice of Italy electronics brands posting organically on YouTube shows a 4.6x views gap between the 25th and 75th percentile, while engagement only separates 3.0x. The algorithm is doing the rest.
Read more
Benchmark
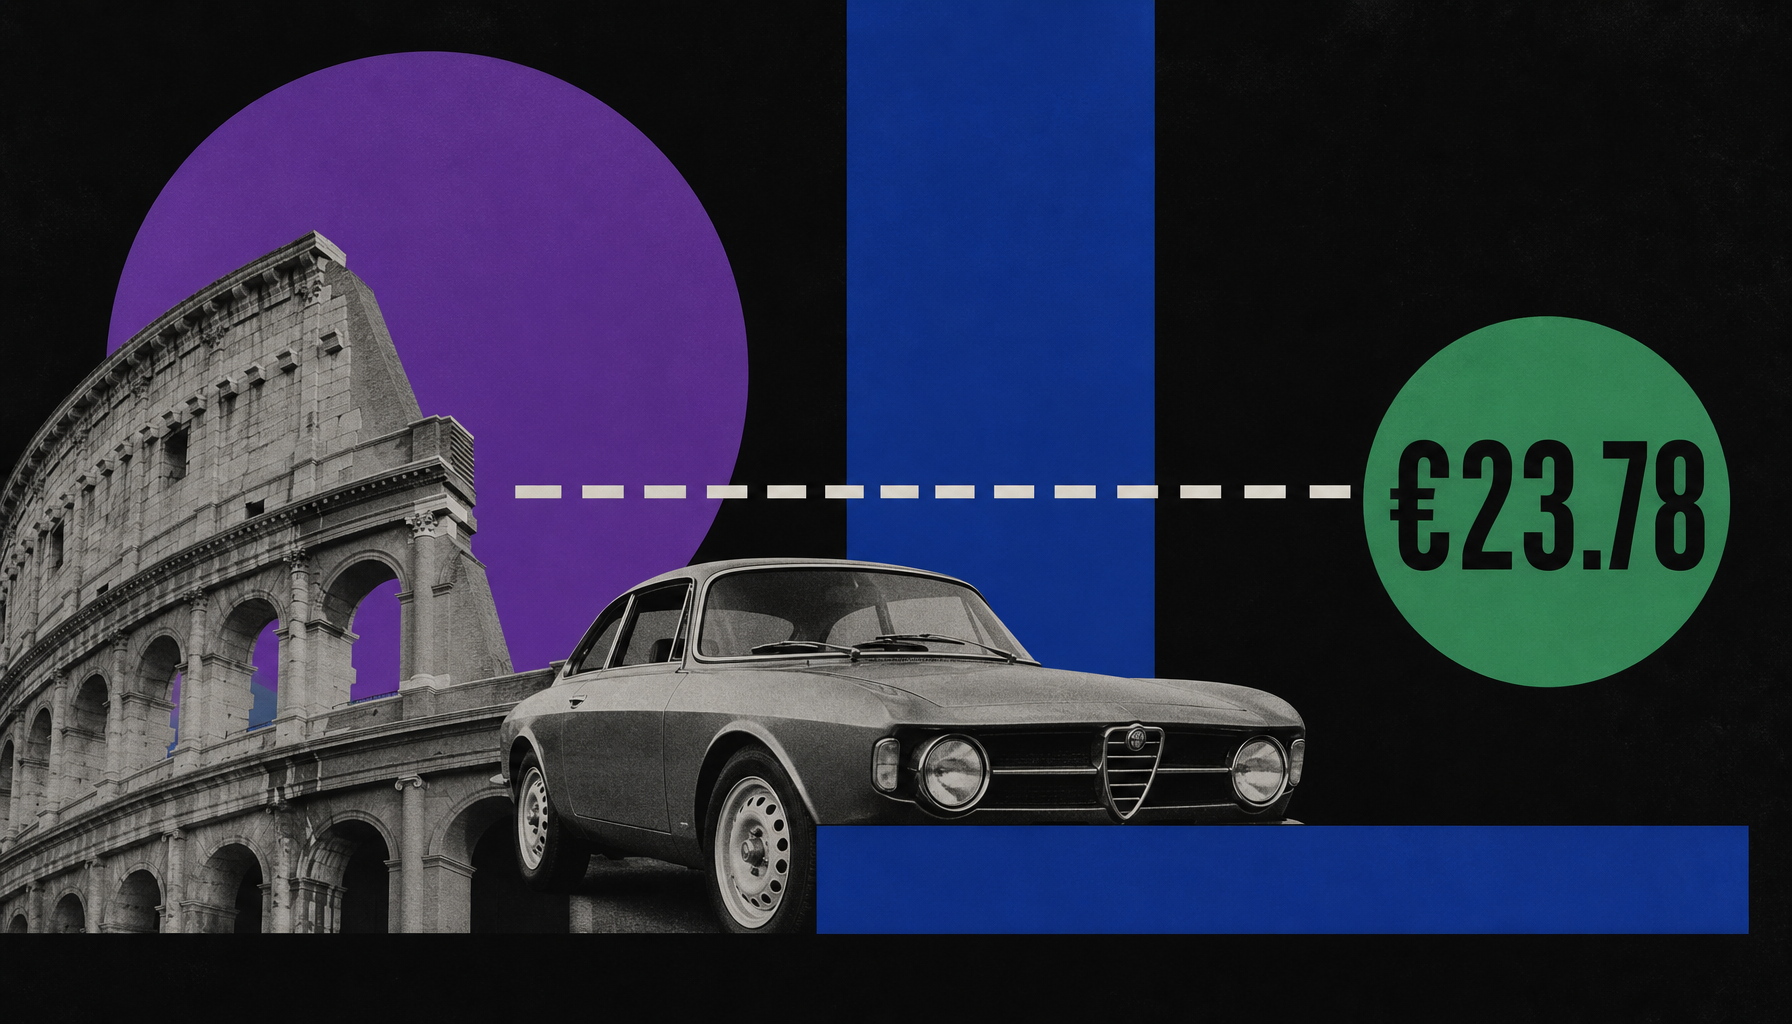
Italy’s Facebook Automotive Awareness Ads Hit a €23.78 Spend Shelf
Italy’s Facebook automotive awareness ads cluster at a €23.78 spend shelf, exposing fragmented testing and a narrow scaling tail.
Read more
Benchmark
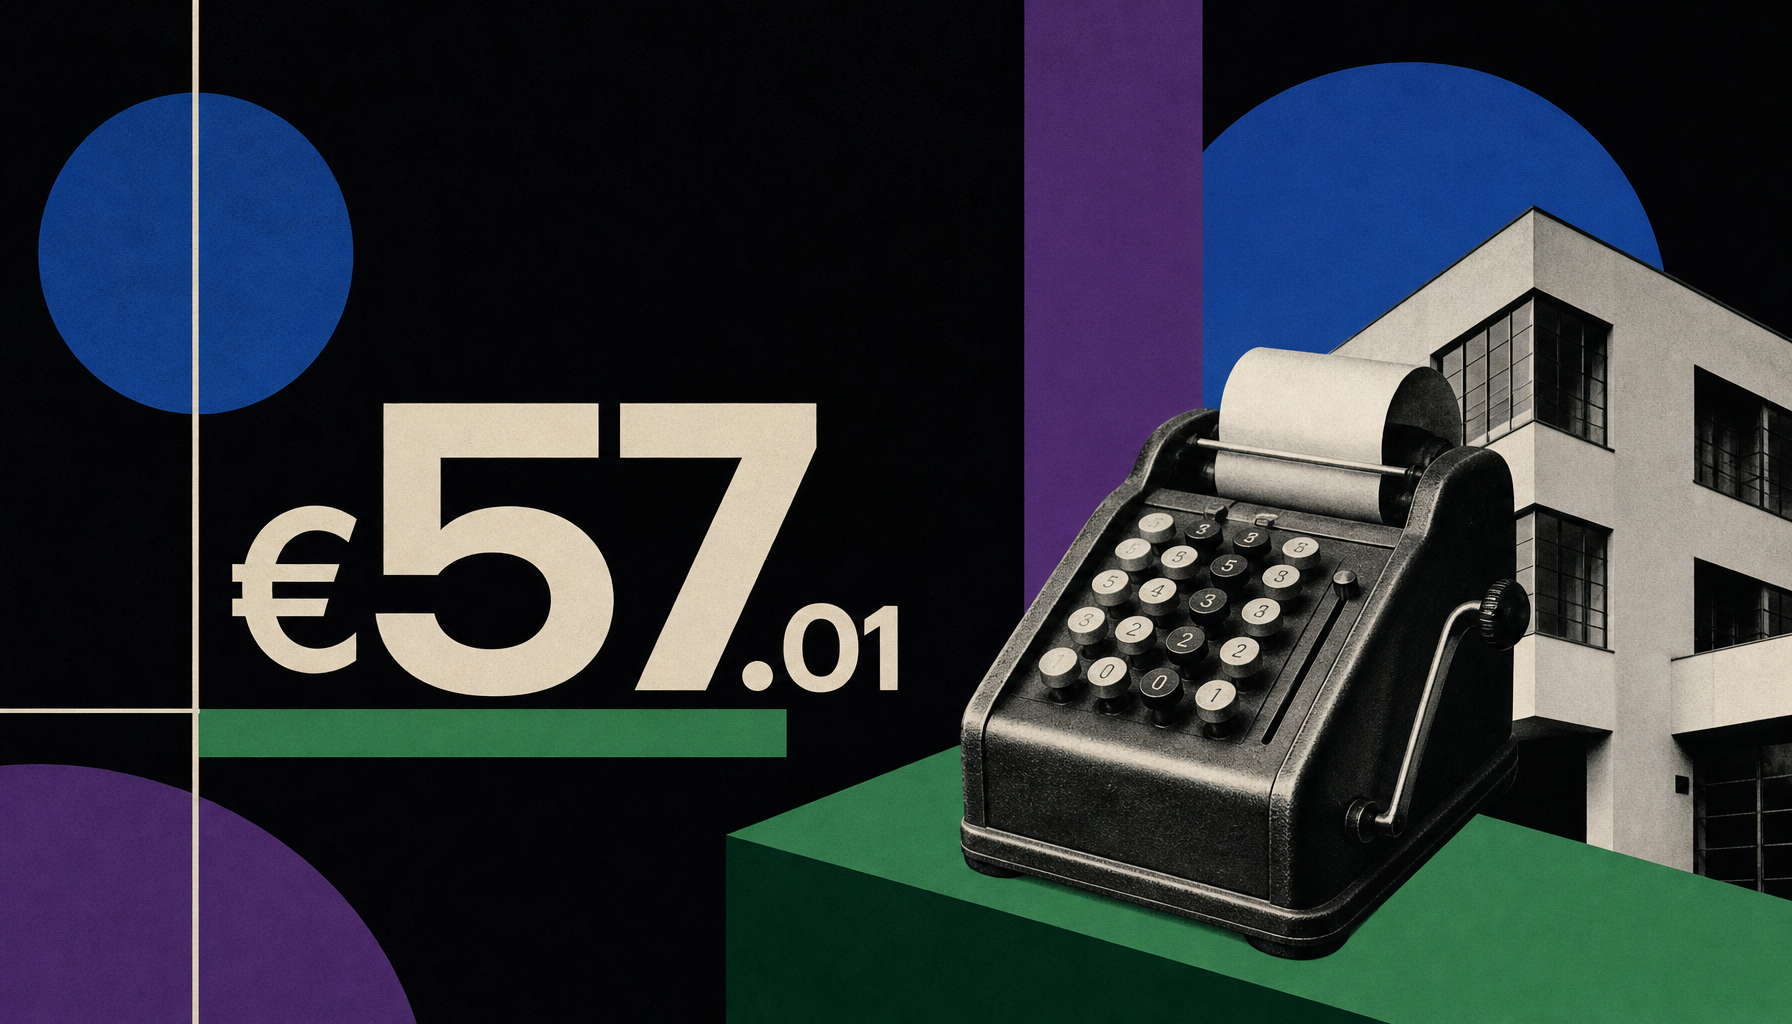
Italy Instagram Retail Marketplaces Are Running a €57 Sales Ad Machine
Italian retail marketplace brands are spreading Instagram sales budgets across thousands of tiny ads. The signal is not CPM efficiency, it is budget fragmentation.
Read more
Benchmark
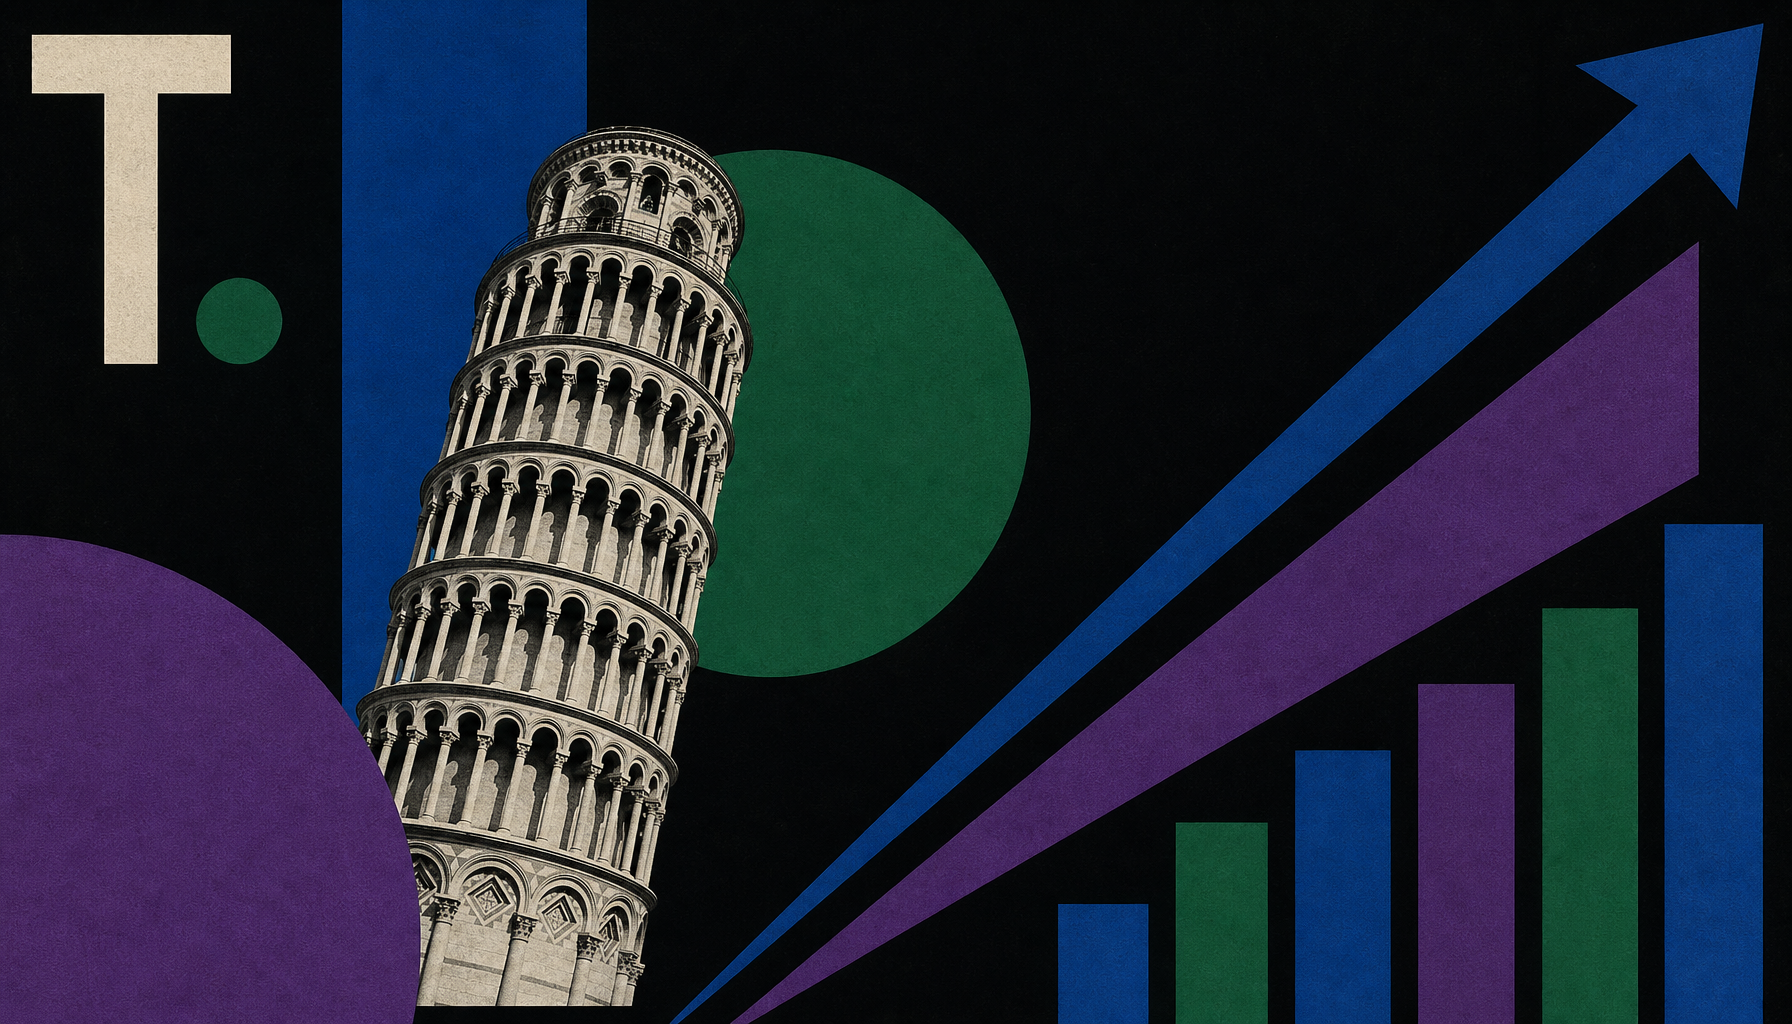
Italy TikTok’s Distribution Tax: Views Separate Winners Faster Than Engagement
Italy TikTok organic benchmarks show a sharp distribution gap: top-quartile posts earn nearly 10 times median views, while engagement rate rises far more slowly.
Read more
Benchmark
Italy TikTok’s Median Trap: Stop Optimizing to 3.62 Percent Engagement
Italian TikTok brands are posting enough to learn, but median engagement is the wrong finish line. The 75th percentile is the better creative signal.
Read more
Benchmark
Italy’s TikTok Treadmill: The Median Brand Is Publishing Hard for 2,650 Views
Italian brands are posting heavily on TikTok, but the median organic post still earns only 2,650 views. The benchmark points to a reach-floor problem, not a content-volume gap.
Read more

Benchmark
Italy TikTok Organic Has a Breakout Problem, Not an Engagement Problem
A 90-day benchmark of 10,000 Italian TikTok posts shows why organic teams should optimize for distribution jumps, not just engagement rate.
Read more
Benchmark
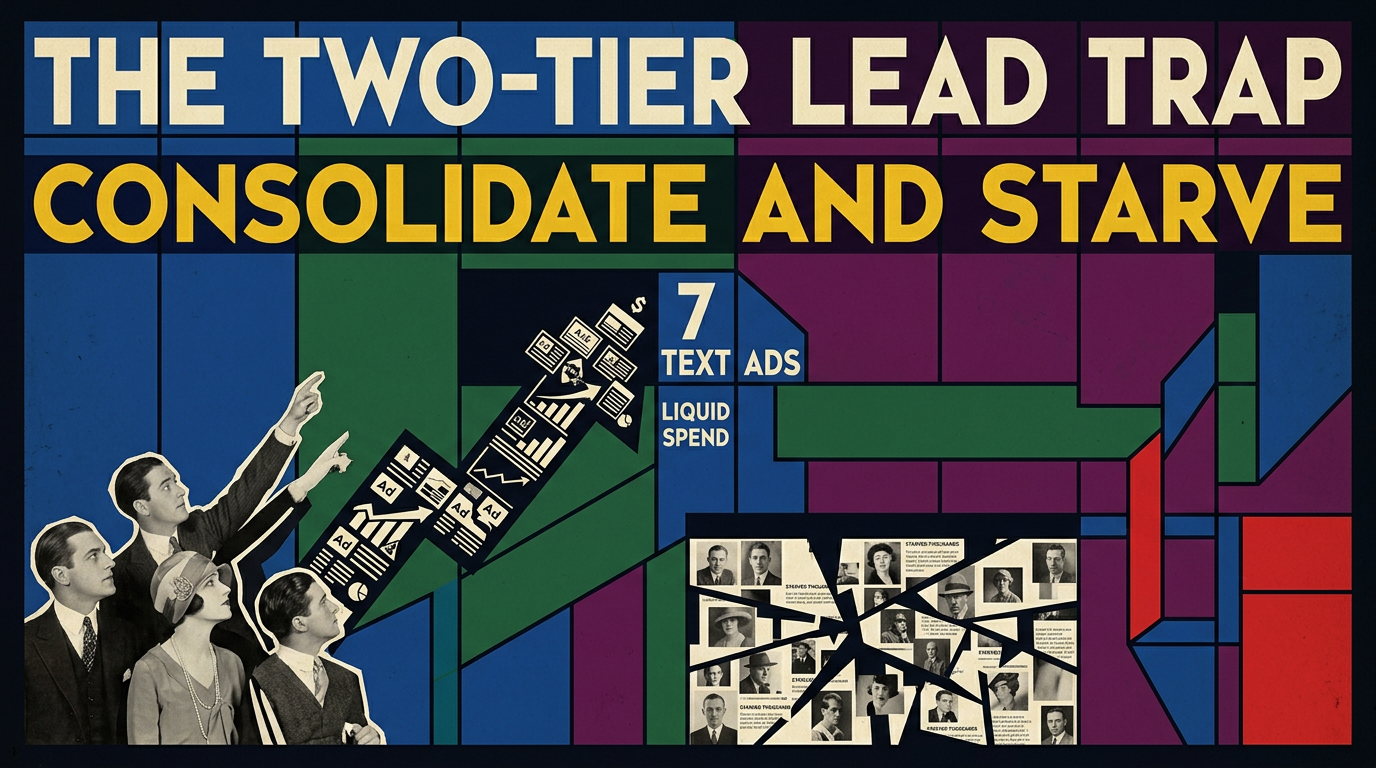
The Two-Tier Lead Gen Trap: How Service Brands Consolidate Spend in 7 Text Ads While Starving Thousands
Analyzing 90-day lead generation data across automotive and service brands reveals a massive structural flaw: thousands of ad accounts starving the algorithm while a few ads hoard the capital.
Read more
Benchmark
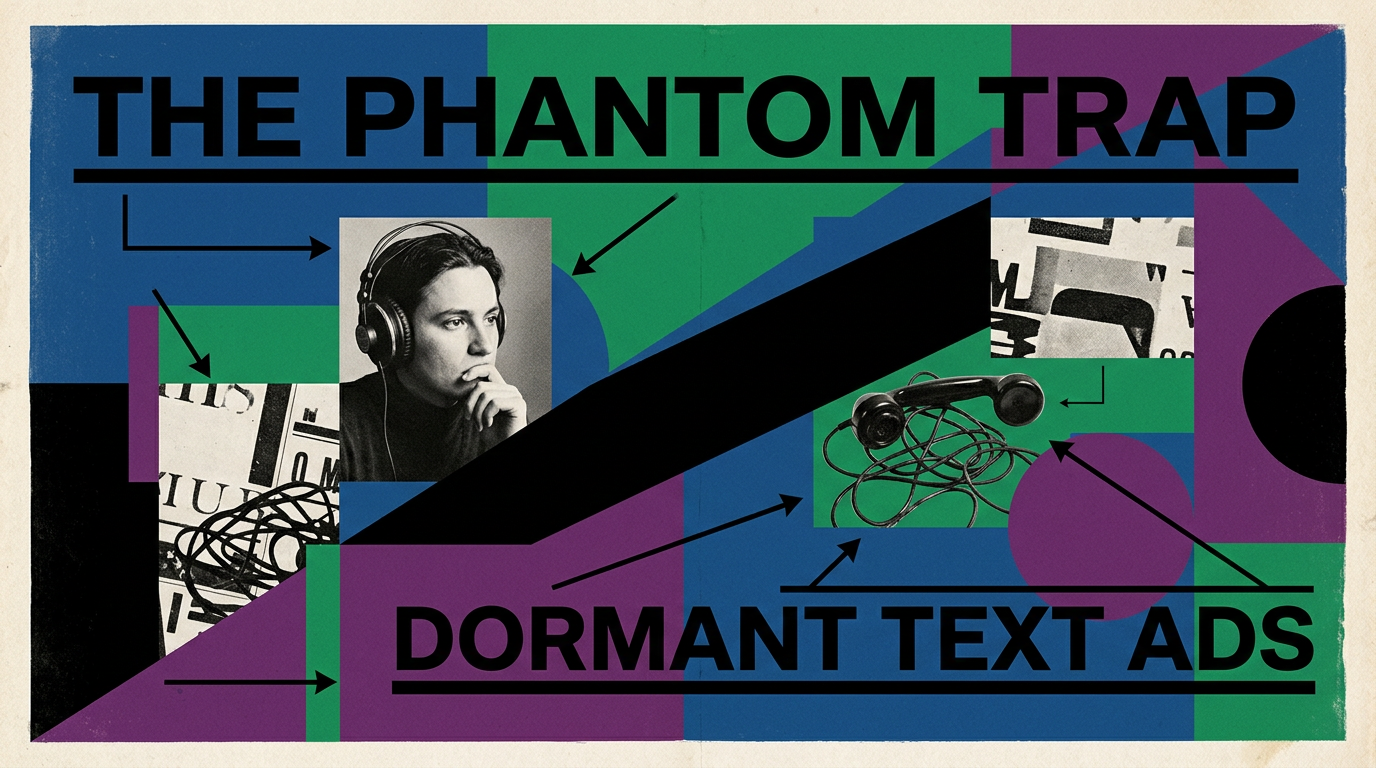
The Phantom Trap: Why One Entertainment Brand Deployed Dormant Text Ads on YouTube
Discover why one major entertainment brand is deploying zero-reach text ads on YouTube. We break down the phantom trap strategy and how operators use dormant campaigns to secure search real estate.
Read more
Benchmark
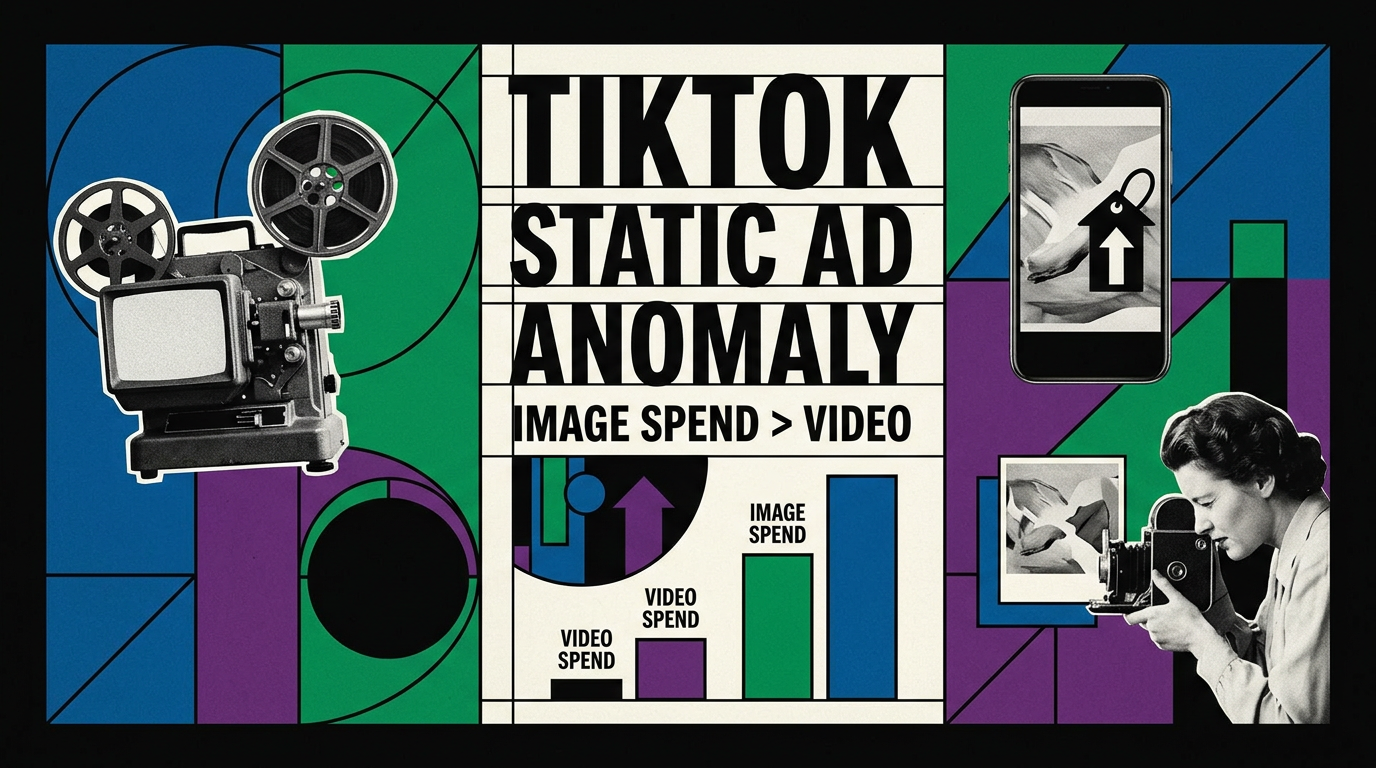
The TikTok Static Anomaly: Why Image Ads Command 95x More Median Spend Than Video
We analyzed 10,000 TikTok ads to find a massive format anomaly. While brands flood the platform with video, static image ads command 95 times more median spend.
Read more
Benchmark
The Co-Op Media Trap: Why 7 Beauty Brands Starved Instagram's Algorithm Across 555 Ad Accounts
An analysis of 1,356 Instagram beauty ads reveals why atomizing budgets across 555 ad accounts destroys algorithmic liquidity and ruins local campaign reach.
Read more
Benchmark
The YouTube Text Anomaly: Why 20 Brands Are Quietly Dumping Millions Into Static Ads
We analyzed 5,120 YouTube ads from 20 brands to uncover a massive disconnect: algorithms are starving video to funnel millions into static text placements.
Read more
Benchmark
The 4,471-Account Anomaly: How Service Brands Are Starving Facebook's Algorithm
We analyze how 7 service brands deployed 10,000 Facebook ads across 4,471 ad accounts and why this hyper-fragmented strategy is destroying algorithmic efficiency.
Read more

Benchmark
The 19-Cent Execution: How 5 Italian Brands are Weaponizing TikTok's Algorithmic Meat Grinder
We analyzed 10,000 TikTok ads from 5 Italian brands to reveal a shocking media buying playbook. Discover why the median video ad spends just 19 cents before being killed, and why image ads are quietly carrying the load.
Read more
Benchmark
The Localized Sharding Playbook: Decoding Italy's 1.9 Million Euro Instagram Retail Sprawl
Discover why 13 Italian brands are abandoning Meta best practices, deploying 1.9 million euros across 722 separate ad accounts while treating organic Instagram as a digital billboard.
Read more

Benchmark
July 2026 EMV Portfolio Analysis: Platform Benchmarks and Trends
Technical B2B analysis of July 2026 EMV portfolio data, detailing month-over-month CPM trends, engagement value ratios, and platform-specific metrics.
Read more
Benchmark
The 30,000-View Phantom: Why Italian Brands Are Posting 3 Times a Day for 5 Interactions
We analyzed 7,695 organic Instagram posts from 26 Italian brands. The data reveals a staggering disconnect: massive view counts masking single-digit interactions.
Read more
Benchmark
The Bifurcated Ad Account: High-Velocity Sales vs. Flagship Awareness
We analyze how 13 brands pushed nearly 2 million euros through 718 fragmented ad accounts on Instagram, and contrast it with MAC Cosmetics' flagship TikTok strategy.
Read more
Benchmark
The 354-Post Treadmill: Why 29 Italian Brands Flooded TikTok With 10,000 Videos
We analyzed 10,000 organic TikTok posts from 29 Italian brands over 90 days. Discover why the algorithmic casino forces brands to post four times a day just to hit the 26,000-view jackpot.
Read more
Benchmark
The 114-Euro Video Ad: Why Four Brands Are Starving Their YouTube Creative
A look at 2,269 YouTube ads reveals operators are churning out video creative only to starve it of budget, while quietly dumping their real ad spend into text search intent.
Read more
Benchmark
The Dealership Dilemma: Why 12 Automotive Brands Atomized 14,000 Euros Across 561 Ad Accounts
Discover why 12 automotive brands wasted 14,000 Euros by fragmenting their ad spend across 561 accounts. We analyze the 3,341-ad cohort to show why algorithmic consolidation beats localized dealership marketing.
Read more
Benchmark
The Illusion of Activity: How One Italian IT Vendor Fed Facebook's Algorithm for Zero Pipeline
A deep dive into why an Italian B2B IT vendor's 90-day organic Facebook strategy yielded just 12 interactions per post, and why marketers must abandon the corporate bulletin board approach in favor of high-leverage activities.
Read more
Benchmark
The Content Treadmill: Why One Italian Tech Brand's 24-Post Facebook Strategy Is a Resource Black Hole
Operators blindly fund organic B2B social calendars. Here is why an Italian IT vendor's 90-day, 24-post Facebook sprint yielded a mere 12 interactions per post.
Read more
Benchmark
The 23-Euro Lead: Why 15 Brands Sharded Their Instagram Ads Across 1,874 Accounts
Discover why 15 brands in Italy are sharding their Instagram lead generation campaigns across 1,874 ad accounts, spending just 23 Euros per ad to dominate local markets.
Read more
Benchmark
The 38-Interaction Ceiling: Why an Italian IT Brand's Facebook Content Strategy is an Expensive Internal Newsletter
We look at an Italian IT brand's 90-day Facebook strategy. With 22 posts yielding just 13 interactions each, it is time to rethink B2B organic social. Stop building external newsletters for your own employees.
Read more
Benchmark
The YouTube Text Paradox: Why 4 Brands Backed Text Over Video With 207,000 Euros
Data from 2,196 YouTube ads reveals a shocking strategy: brands are rapidly killing video tests while quietly scaling text ads with 28x the budget commitment.
Read more
Benchmark
The Bulletin Board Reality: Why Amazon Italy's 48-Post Facebook Sprint Barely Breaks 65 Interactions
Discover why Amazon Italy published 48 studio-grade Facebook posts over 90 days only to average 65 interactions per post. Learn why copying the organic social strategy of retail giants is a fatal trap for mid-market operators.
Read more
Benchmark
The 1.60-Euro Video Ad: Why 14 Brands Are Sharding Engagement Across 2,548 Accounts
We analyze a 120-day cohort of 4,787 engagement ads to reveal how 14 brands are hacking CPMs by sharding their budgets across 2,548 local ad accounts.
Read more
Benchmark
The 56-Post Illusion: Why a Gaming Brand's Relentless YouTube Schedule Yields Just 295 Views a Video
A deep dive into the YouTube performance of a gaming brand publishing 56 videos in 90 days. We explore the discovery barbell, the engagement paradox, and why volume kills reach.
Read more
Benchmark
The Sharded App Install Strategy: Why Services Brands Are Deploying 264 Ad Accounts for App Promotion
We analyze a 562-ad cohort to reveal why services brands are breaking modern user acquisition rules, sharding app promotion across 264 ad accounts.
Read more
Benchmark
The One-Interaction Reality: Why an Italian Electronics Brand Is Posting to Nobody on Instagram
A close look at an Italian electronics brand's Instagram strategy, where a 90-day posting schedule yields exactly one interaction per post.
Read more

Benchmark
The 10-Euro Lead Gen Ticket: Why Auto Brands Shard Facebook Ads Across 1,000 Local Accounts
Analysis of 8,457 Facebook lead generation ads reveals automotive brands are replacing centralized campaigns with thousands of 10-Euro micro-tests deployed across local dealer accounts.
Read more
Benchmark
The 500-Post Quarter: Why Italian Brands Treat TikTok Like a High-Frequency Trading Desk
An analysis of 10,000 organic TikTok posts reveals Italian brands are publishing 5.5 times a day. We explore why operators are abandoning polish for volume to chase 28k-view algorithmic breakouts.
Read more

Benchmark
The 50x CPM Chasm: What 10,000 Lead Gen Ads Reveal About Algorithmic Micro-Testing
An analysis of 10,000 lead generation ads in Italy reveals a massive split in CPMs and a rigid 24-Euro budget cap per algorithmic test.
Read more

Benchmark
The Polish Penalty: Why a Premium Auto Brand's 47-Post Sprint Yielded 7 Interactions Per Post
Why publishing 47 polished Instagram posts in 90 days yielded just 7 interactions per post for one premium auto brand, and how to fix the Polish Penalty.
Read more
Benchmark
The 33-Cent Auction: How One Beauty Brand Hacks TikTok Reach With 18-Euro Micro-Tests
Discover how one beauty brand ignores the standard TikTok playbook, using 18-Euro test budgets to unlock 33-cent CPMs and reach over 33,000 users daily.
Read more

Benchmark
The Ghost Reach Epidemic: Why 28,000 Instagram Views Yield Just 6 Interactions
We analyzed 6,863 Instagram posts from Italian brands to uncover a massive disconnect: while median views hit 27,000, interactions flatline at just six. Here is how operators need to pivot.
Read more
Benchmark
The Barbell Budget: Why Retail Marketplaces Cap Video Tests at 24 Euros but Pour Thousands into Static Images
We analyze 165 lead gen ads from retail marketplaces to reveal why operators cap video tests at 24 Euros but pour thousands into high-intent static images.
Read more
Benchmark
The 42-Cent Flatline: How Entertainment Brands Game TikTok Auctions with 67-Euro Micro-Tests
Analyze a 90-day cohort of 426 TikTok entertainment ads to reveal how operators use a flat 0.42 EUR CPM and 67 EUR micro-budgets to relentlessly test creatives.
Read more

Benchmark
June 2026 EMV Portfolio Performance and MoM Trends
Technical analysis of June 2026 EMV performance and MoM trends across major social platforms, based on first-party portfolio data from objective-driven campaigns.
Read more
Benchmark
The Micro-Targeting Paradox: Why Italian Instagram Campaigns Burn 509k Euros in 23-Euro Increments
Discover why elite media buyers in Italy are fragmenting enterprise ad budgets into thousands of 23-euro micro-tests on Instagram. We analyze a cohort of 10,000 ads to reveal the 21x CPM pricing spread and the algorithmic reach ceilings.
Read more
Benchmark
The Hyper-Local Paradox: Why Electronics Brands Buy Facebook Reach in Batches of 500
Analysis of 10,000 Facebook awareness ads reveals how electronics brands use rigid 23.78 EUR budgets to frequency-bomb hyper-local catchments of just 500 people.
Read more
Benchmark
The Volume Trap: Why Posting 114 Times on Facebook Yields Just 38 Interactions for Fashion Affiliates
A deep dive into why high-volume Facebook organic posting fails for fashion affiliates, and how operators can use low interaction caps as a signal for paid media.
Read more

Benchmark
The Syndication Skew: Why Italian Automotive Brands Average 420 Posts but Median Just 16
Italian automotive brands published 8,411 organic posts in 90 days, but the median brand posted just 16 times. Discover how syndication skews the baseline and why a 7.6 percent engagement rate is required to unlock a massive reach multiplier.
Read more
Benchmark
Anatomy of a Gaming TikTok: Why a 7.6 Percent Engagement Rate is the New Breakout Threshold
We analyze a gaming brand's organic TikTok output to reveal why a 4.8 percent engagement rate yields only 3,000 views, and what it takes to break out.
Read more

Benchmark
The Silent Grid: Why IT Services Campaigns Fade on Visual Platforms
Discover why IT services brands struggle to generate engagement on visual platforms and how operators can pivot their strategy toward employer branding to find actual return on investment.
Read more