Italian Marketplaces Barely Fund Facebook Awareness While Instagram Gets 125 Views
A 90-day snapshot of Italian marketplaces shows tiny Facebook awareness budgets and a 125-view Instagram post median. Here is how to act on the data.
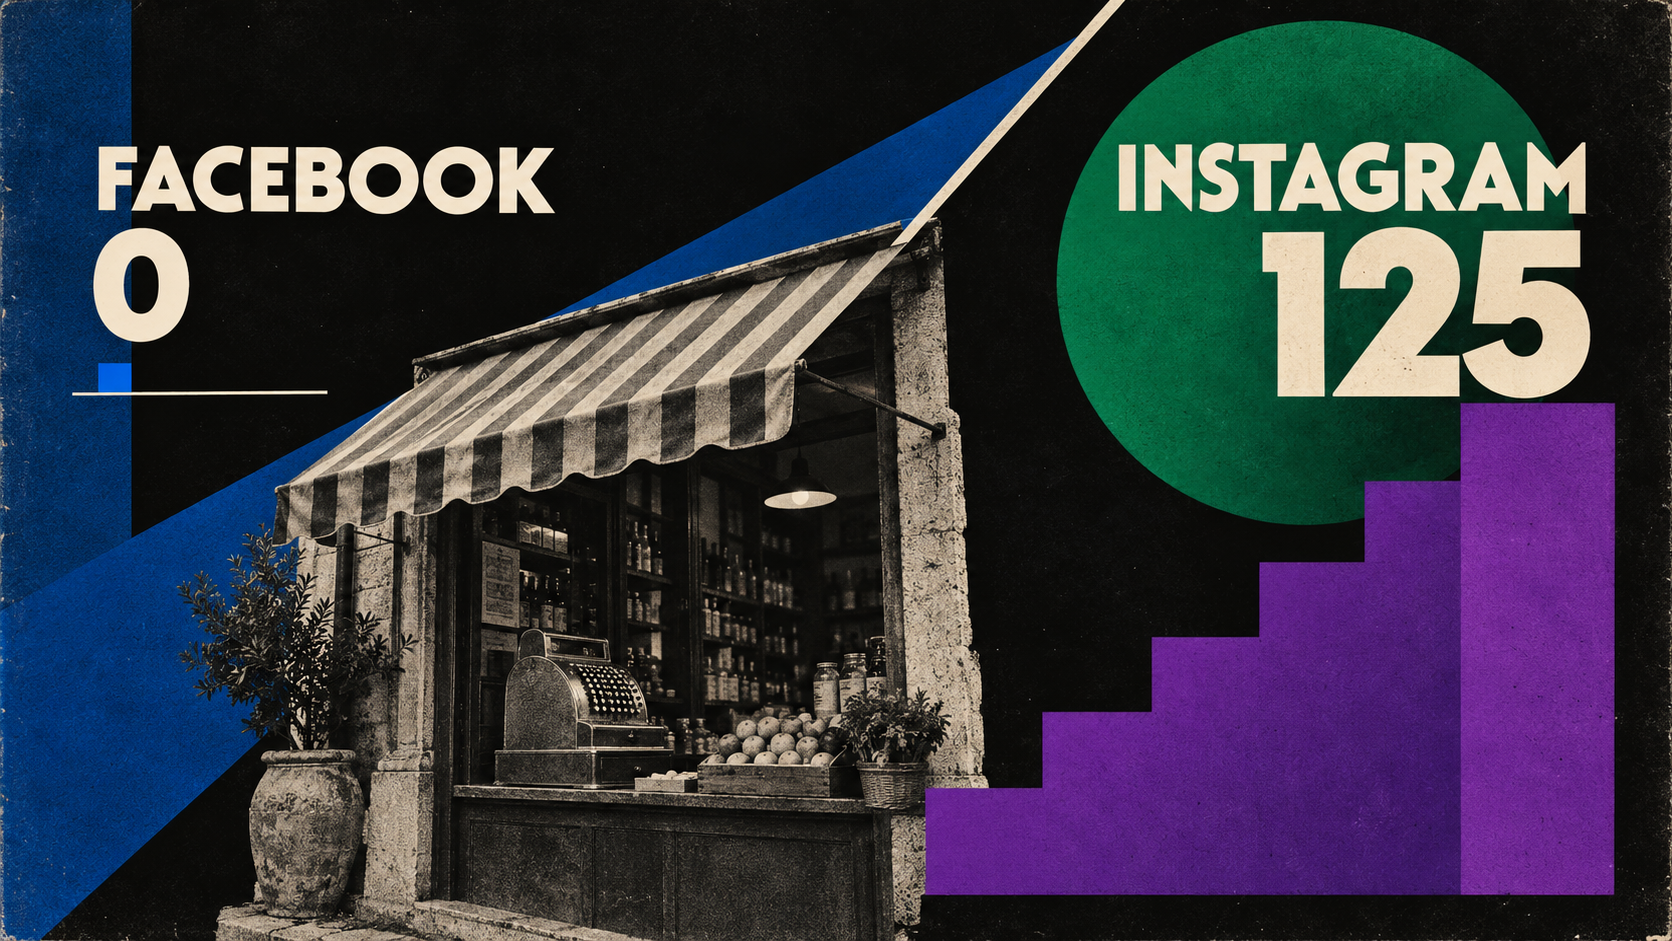
Italian retail marketplaces have a clear gap between their Facebook awareness activity and Instagram organic distribution. Across a 90-day snapshot, most Facebook ads in the cohort received little spend and reported zero median daily reach. Instagram posts, meanwhile, had a median of 125 views.
That is not proof that organic Instagram is a better investment in every case. The datasets measure different things: paid ads and organic posts, with different units and delivery conditions. But the contrast is useful for operators reviewing whether their paid awareness campaigns are funded well enough to deliver or learn.
Facebook awareness spend is spread thin
The paid cohort contains 266 Facebook awareness ads from 13 Italian retail marketplace brands, distributed across 78 ad accounts. Total spend was about €30,880 over the 90-day period ending October 6, 2026.
The median ad spent €0.46, and the 75th-percentile spend was €4.41. In other words, at least three-quarters of the ads spent no more than €4.41. Median reach per day was zero. The median lifetime EU reach was 3,530, so the typical ad had some historical reach even though its daily reach was zero at the time or over the reporting basis used in this cohort.
No ads returned usable CPM values. That means this dataset cannot support a reliable comparison of Facebook media costs or conclusions about which creative formats are cheapest. All 266 ads were classified as format unknown in the data pull.
These figures suggest a fragmented paid setup, but they do not establish why individual ads had little delivery. Ads may have been paused, ended, or otherwise inactive. Before drawing conclusions about campaign performance, teams should check status, dates, budgets, and delivery in their own ad accounts.
Instagram has a modest, measurable baseline
The organic comparison includes 2,049 Instagram posts from 15 brands over the same 90-day window. A typical post received 125 views and three interactions. The median engagement rate was 0.058 percent.
| Instagram metric per post | 25th percentile | Median | 75th percentile |
|---|---|---|---|
| Views | 64 | 125 | 1,960 |
| Interactions | 1 | 3 | 9 |
| Engagement rate | 0.014% | 0.058% | 0.129% |
The spread is wide: the 75th-percentile post received 1,960 views, far above the median. That indicates a small group of posts reached substantially more people than the typical post. It does not tell us which creative choices caused that result, so teams should treat the upper quartile as a reference point for review, not as a guaranteed outcome.
The median brand published three posts during the period. That cadence statistic is not a measure of total content production across every brand, but it is a reminder to examine how often each account publishes alongside the results of individual posts.
What operators can do with the comparison
The practical lesson is not to abandon Facebook awareness or assume Instagram organic will outperform paid media. It is to distinguish between campaigns that are merely present in an account and campaigns with enough active delivery to produce useful evidence.
- Audit campaign status and delivery. Review whether low-spend ads are active, paused, completed, or constrained. Separate historical ads from current campaigns before using them as benchmarks.
- Reduce unnecessary fragmentation. With 78 ad accounts across 13 brands, teams should check whether account and campaign structures make budgets and results difficult to interpret. Consolidate where governance and business needs allow.
- Give tests a clear purpose and budget. Fund fewer test cells at levels appropriate to the objective and market. Set a delivery threshold and a review period in advance, then assess whether each test generated enough evidence to make a decision.
- Study organic outliers. Compare posts near or above the 1,960-view 75th-percentile mark with typical posts. Look for differences in topic, format, timing, and opening hook, while avoiding assumptions about causation from this dataset alone.
- Use paid support as a measured test. If a post performs well organically, consider testing paid distribution against a defined audience and objective. Compare results using appropriate paid metrics rather than treating organic views and paid reach as interchangeable.
Read the numbers in context
The paid cohort covers 266 Facebook awareness ads, 13 brands, and 78 ad accounts. It recorded approximately €30,880 in total spend, with a median spend of €0.46 per ad and a median daily reach of zero. The organic cohort covers 2,049 Instagram posts from 15 brands, with median results of 125 views and three interactions per post. Both datasets span the 90 days ending October 6, 2026.
These are cohort medians and percentiles, not forecasts for a specific advertiser. They also do not establish that the same brands appear in both platform samples. Use them as prompts for account-level analysis rather than as a direct platform-versus-platform efficiency test.
For Italian marketplace teams, the strongest next step is straightforward: verify whether Facebook awareness campaigns are genuinely delivering, simplify structures that obscure performance, and learn from Instagram posts that materially exceed the cohort’s typical results. Spend should follow a clear test plan, not the mere existence of ads in an account.
Keep Reading
Start with one monitor. Free.
Add a brand, paste a couple of competitor handles, and see your first calibrated readout in under five minutes.