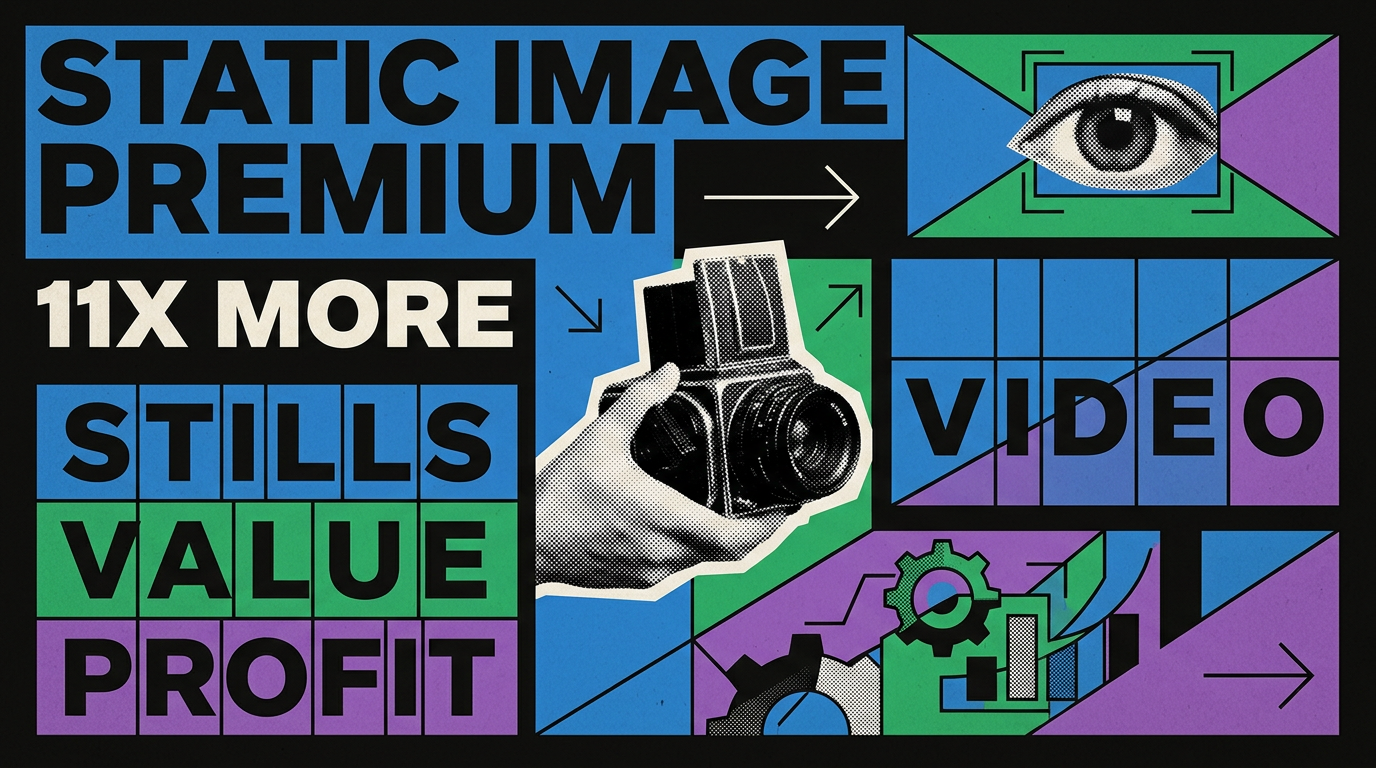
The Static Image Premium: Why TikTok Testers Spend 11x More on Photos Than Video
Data from 8,000 TikTok ads reveals a hidden arbitrage: operators are cutting video tests at 1. 60 EUR but scaling static image ads 11x higher.
The mandate to prioritize short-form video has dominated social media strategy for three years. Marketers are repeatedly told to act like creators, prioritize motion, and abandon static assets. But a quiet inversion is happening inside the actual media buying platforms. When you ignore the creative advice and look directly at the ad spend, the narrative completely collapses.
We analyzed a 90-day cohort of 8,042 TikTok ads deployed by just five brands in the Italian market [1]. The total spend across this concentrated cluster of brands was staggering at 1,081,551 EUR. But the way that budget was allocated between formats reveals a structural flaw in how most operators think about TikTok.
The Video Graveyard
The vast majority of the volume in this cohort is indeed video. Operators deployed 6,282 video ads over the three-month window. Because they are operating in the Italian market, the media is exceptionally cheap. The median CPM for these videos sits at 0.30 EUR [1]. Operators are paying literal pennies to reach thousands of users.
But despite the massive overall spend, the median spend per video ad is an incredibly low 1.60 EUR [1]. Think about the mechanics behind that number. The algorithm, or the automated rules deployed by the media buyers, is executing a ruthless kill switch. Videos are pushed into the feed, they buy a few thousand cheap impressions, and if the conversion or retention signal is not immediate, the ad dies instantly.
This is not a traditional brand campaign. This is a high-velocity, algorithmic sorting mechanism. Five brands produced over 6,000 videos in 90 days, which equals roughly 14 new videos per brand, per day. They are throwing cheap creative at a cheap auction and letting the platform kill the losers immediately.
The Static Image Premium
The surprise comes when we filter for image ads. The exact same five brands deployed 1,760 image ads during the same 90-day window [1]. If TikTok is purely a video platform, static assets should fail to scale.
Instead, the median spend on image ads is 18.14 EUR [1]. That is more than eleven times higher than the median spend on video ads. The CPM for images is slightly higher at 0.32 EUR, but the scale is fundamentally different.
| Format | Ad Volume | Median CPM | Median Spend |
|---|---|---|---|
| Video | 6,282 | 0.30 EUR | 1.60 EUR |
| Image | 1,760 | 0.32 EUR | 18.14 EUR |
Operators are willing to fund static images for significantly longer periods. Why are brands spending 11x more per ad on images? There are two primary drivers at play.
First is cognitive load. A static image or a swipeable carousel allows the user to consume the value proposition at their own pace. For complex products or direct response offers, this is often superior to a fast-paced video. Second is catalog integration. E-commerce operators are pushing dynamic product catalogs directly into TikTok, allowing the system to auto-generate image combinations that consistently find buyers.
"The data proves you do not need to subsidize losing videos. By leveraging 0.30 EUR CPMs, you can buy enough data for 1.60 EUR to know if a video works. But more importantly, it gives you permission to stop burning resources on mediocre video production if images are scaling better."
Contrasting With Rigid Testing Limits
To understand how unique this fluid budget allocation is, we have to look at other sectors. We pulled a 120-day cohort of 3,331 lead-generation ads in the education industry [2], plus another 2,786 app-promotion ads in the gaming industry [3].
Across both of those massive cohorts, the median spend sits at exactly 23.78 EUR [2] [3].
That 23.78 EUR figure is a rigid structural ceiling. It is the mathematical equivalent of setting a strict daily budget cap and letting the test run regardless of early performance. Operators in the gaming and education sectors are deploying thousands of ad accounts to isolate their tests. The education cohort features 6 brands utilizing an absurd 1,049 ad accounts [2]. The gaming cohort features 4 brands spread across 534 ad accounts [3].
These operators are isolating every single creative test in its own sandbox, forcing a minimum spend of roughly 24 EUR per ad to guarantee statistical significance.
The Operator Takeaway
The rigid testing structures found in gaming and education work when you are trying to force a result in a highly competitive auction. But the Italian TikTok cohort proves there is an alternative model.
You can use the platform's insanely cheap inventory to test creative viability for under two euros. Stop forcing your creative team to churn out thousands of low-quality videos just to feed the machine. The big spenders are finding eleven times more scale with static images. It is time to add photos back to your creative brief.
Keep Reading
Frequently Asked Questions
Start with one monitor. Free.
Add a brand, paste a couple of competitor handles, and see your first calibrated readout in under five minutes.