€5 Median, €249 Mean, 194 Ad Accounts: How Italy's Marketplace Brands Actually Buy Instagram
Italian retail marketplace brands on Instagram exhibit a 50-to-1 gap between mean and median spend, driven by federated ad accounts and micro-budget testing.
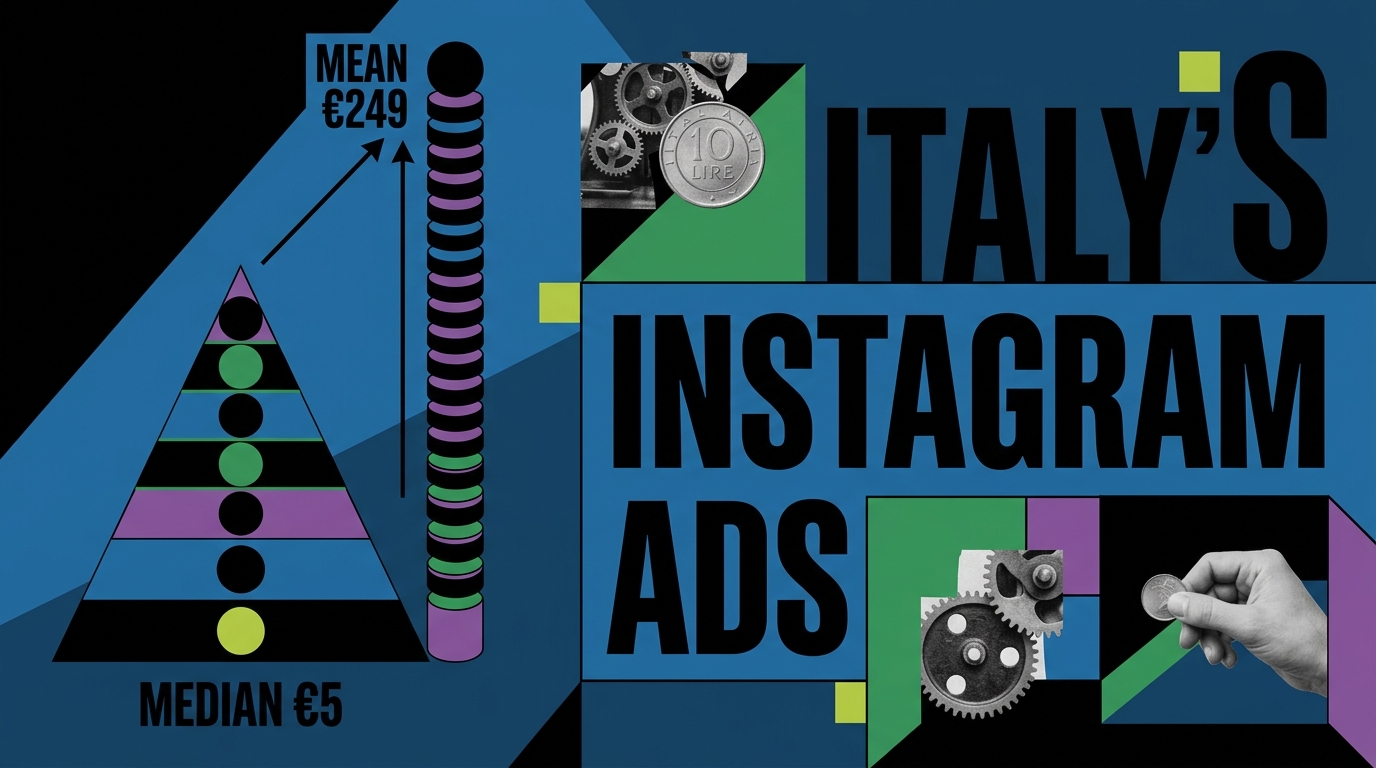
The Italian retail marketplace category on Instagram generated €220,565.81 in ad spend over a 90-day window across 886 distinct creative units [1]. The median ad behind that cumulative figure spent exactly €5. The arithmetic mean, by contrast, stood at approximately €249. A 50-to-1 divergence between the mean and median is not an artifact of bad math or statistical noise; it reveals the core architecture of how marketplace brands deploy budget on the platform. A minuscule cadre of high-budget campaigns sits atop an enormous baseline of near-zero exploratory tests. Any media planner who evaluates this vertical using average spend will misread the competitive landscape by two orders of magnitude.
The Distribution in One Table
| Metric | Cohort Value |
|---|---|
| Total ads in 90-day window | 886 |
| Unique brands | 17 |
| Unique ad accounts | 194 |
| Total spend (90 days) | €220,565.81 |
| Spend 25th percentile (p25) | €0.58 |
| Spend median (p50) | €5.00 |
| Spend 75th percentile (p75) | €39.33 |
| Implied mean spend | ~€248.95 |
| EU total reach median (p50) | 14,744 |
| Ads with reported CPM | 0 |
| Ads with unknown format | 886 |
These quartile boundaries double as a pacing guide for the Italian market. One-quarter of all ads logged in this category spent less than €0.58, which is less than the cost of an espresso. Fully three-quarters spent less than €39.33. If an advertiser committed more than €40 behind a single Instagram ad creative in Italy during this period, that creative sat comfortably in the top 25% of all category deployment by spend [1]. That threshold is strikingly modest. Media planning decks frequently presume that competitors are flooding the auction with deep pockets; empirical data shows that 75% of the active creative inventory is essentially unfunded.
The upper deciles carry the financial weight. With the median spend pinned at €5 against an aggregate pool of €220,565.81, the entire cohort spends an average of roughly €2,451 per day across the country [1]. The 8-to-1 ratio between the 75th percentile (€39.33) and the median (€5.00) confirms that spend does not scale linearly. It behaves like a power-law cliff, with a wide, flat ledge at the bottom where hundreds of creatives receive token allocations.
194 Accounts Under 17 Brands
The most revealing organizational metric in this cohort is account volume. Seventeen brands operate through 194 distinct ad accounts, yielding an average of more than 11 ad accounts per brand entity [1]. Across those accounts, the 886 ads break down to roughly 4.6 ads per account.
A typical direct-to-consumer brand consolidates operations into one to three ad accounts to pool algorithmic learning and minimize conversion signal dilution. An 11-to-1 ratio is the operational footprint of a marketplace platform. This pattern reflects several underlying structures: individual merchant or seller storefronts operating separate billing profiles, franchised regional business units managing local territory budgets, external agencies operating isolated sandbox accounts, or distinct product categories divided into discrete administrative silos. All of them deploy capital under the parent brand umbrella.
For competitive intelligence teams, account topology is a vital diagnostic tool. Spend figures reveal how much capital enters the system; account graphs reveal how organizations govern their spend. Auditing the ad accounts connected to rival marketplace domains clarifies whether a competitor runs a centralized command structure (few accounts running large budgets) or a federated seller network (dozens of accounts running fragmented micro-budgets). On Italian Instagram, marketplace brands overwhelmingly choose the federated route [1].
The Reach Paradox
All 886 ads in the cohort report an EU total reach figure, with a median value of 14,744 [1]. Setting a median spend of €5 next to a median reach of nearly 15,000 users looks counterintuitive on its face. Two critical caveats govern how this number must be interpreted:
First, the median spend and median reach metrics describe the cohort distribution independently. They do not necessarily belong to the exact same creative unit. Second, transparency repositories often report EU total reach across an advertiser's broader delivery footprint rather than the exact platform-isolated impression slice tied to a specific spend line. Reach figures can capture multi-placement delivery or blended multi-account exposure. Media buyers should treat 14,744 as an indicator of presence rather than a reliable calculation of per-euro unit economics. What the metric does confirm is that platform reach logging remains comprehensive even when an ad account commits pennies.
The Measurement Void
Alongside the active metrics, the data reveals significant measurement gaps that every media buyer must account for:
First, zero out of 886 ads populated a CPM value [1]. This is not a low-density sample; it is an absolute absence. Anyone presenting a standard platform-level CPM benchmark for Italian retail marketplaces from this dataset is relying on external assumptions.
Second, the format field registers as "unknown" for all 886 ads [1]. Platform telemetry does not differentiate whether these impressions ran as Stories, Reels, or traditional Feed placements. Strategic debates about Stories versus Reels efficiency cannot be resolved using library records for this category.
Third, although 841 ads populated a daily reach tracking field, the 25th, 50th, and 75th percentiles all register at zero [1]. Flight duration data exists structurally in the reporting schema, but the daily volume metrics reflect zero sustained velocity across the mid-tiers.
Finally, platform comparisons are constrained this cycle: counterpart queries for Facebook retail marketplace metrics in Italy failed at the database execution layer [2]. Although individual heavyweights like Lidl Italia run multi-million-reach campaigns across Facebook surfaces [3], aggregate cross-platform parity cannot be established without a clean cohort pull.
Strategic Takeaways for Media Buyers
- Recalibrate pacing assumptions: A quarterly budget of €50 on a single ad puts an asset into the top quartile of Italian retail marketplace creative on Instagram. Stop assuming competitors are spending thousands per variant.
- Abandon category averages: The €249 mean reflects the extreme right tail of the spend curve. Managing campaigns toward the mean misjudges how 90% of the active market operates.
- Map accounts rather than brands alone: When analyzing rivals, dissect their ad account graph. Eleven accounts per brand indicates distributed operational teams or merchant co-op funding rather than unified central management.
- Build intelligence around verified attributes: Because CPM and format tags are entirely blank in transparency data, focus competitive research on spend tiers, reach scale, and account structure.
Keep Reading
Start with one monitor. Free.
Add a brand, paste a couple of competitor handles, and see your first calibrated readout in under five minutes.