Seventeen Brands, Ninety-Nine Ad Accounts, €979: Italian Services Is Testing Instagram One Ad at a Time
Italy's services vertical ran 122 Instagram awareness ads through 99 ad accounts for €979. 17 in 90 days. The reach numbers do not survive a join with spend.
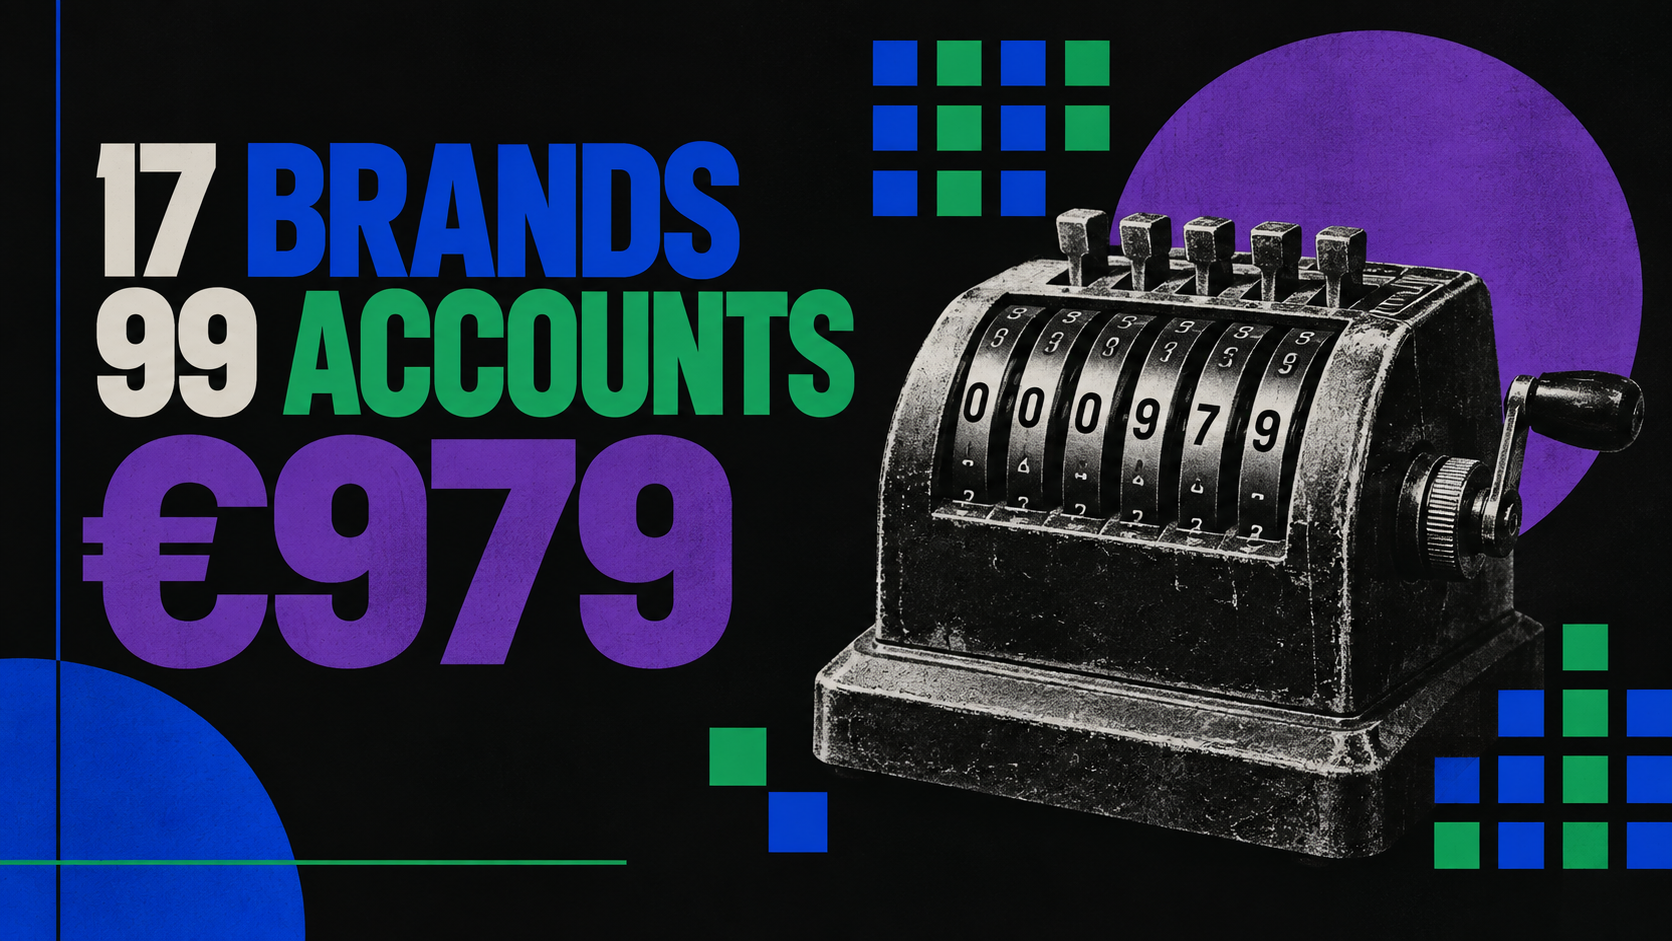
For the 90 days ended September 23, Italy's services vertical put 122 Instagram ads into the market under the awareness objective. They came from 17 brands, ran through 99 separate ad accounts, and cost €979.17 in total [1]. The median ad spent €2.78 over the entire quarter. The ad at the 75th percentile spent €8.96 [1].
This is not an awareness program. It is a quarter of coin flips, and the account structure is the proof.
Ninety-nine accounts, 1.2 ads each
The arithmetic of the sprawl: 122 ads across 99 ad accounts averages 1.2 ads per account, and 99 accounts across 17 brands averages 5.8 accounts per brand [1]. Whatever the cause, multi-location operators, agencies spinning up a sandbox account per client, or boosted-post flows that mint a fresh account every time, the effect is the same. Frequency never accumulates, audiences never pool, and no creative gets a second flight. Each account's single-ad experiment teaches nobody anything, including the brand that paid for it.
| Cohort: Italy, services, Instagram, awareness, 90 days (Jun 25 to Sep 23, 2026) | Value |
|---|---|
| Ads | 122 |
| Brands | 17 |
| Ad accounts | 99 |
| Total spend | €979.17 |
| Spend per ad, p25 / p50 / p75 | €1.18 / €2.78 / €8.96 |
| EU total reach, median per ad | 3,816 |
The fields that came back empty
Pull this cohort into a dashboard and four things stand out [1]:
- CPM is null on all 122 ads. Not one row carries a price for reach.
- Reach per day is reported on 120 of the 122 ads, and it is zero at the 25th, 50th, and 75th percentile.
- Format is "unknown" on every single ad.
- EU total reach is populated on all 122 ads, median 3,816 per ad.
So the pipe that counts people is switched on while the pipes that price and shape delivery are switched off. A dashboard built on this export shows reach going up with no rate, no format, and no daily curve. It reads like free media. It is not.
Close the ledger and it breaks
Do the join the dashboards will not.
The per-ad version is just as blunt. A median €2.78 ad at the carousel card buys about 1,120 impressions. To honestly buy 3,816 deliveries you need roughly €9.44, which sits just above the 75th-percentile spend of €8.96 [1][2].
There are two readings, and both are bad for benchmark hygiene. Either the reach field is contaminated, with account-level or organic reach bleeding into ad rows, or the spend field undercounts. Anyone ranking Italian services campaigns off a raw export will conclude this vertical earns sub-euro CPMs on Instagram. It does not. The cost and reach fields simply never met.
The card that prices the floor
Instagram Feed Carousel, Italy, portfolio snapshot for August 2026: CPM €2.4751, reaction €0.2547, comment €0.80, share €1.50, save €0.60, view €0.0391 [2].
Sit with this one row, because it is the cheapest Instagram placement on the Italian board and therefore the reference price for everything above it. A services brand holding the cohort's median budget converts it into roughly 1,120 carousel impressions. Note the value book underneath: a share is priced at €1.50, so a single organic-quality share is worth more than half of the median ad's entire quarterly spend. Reactions carry real money too at €0.2547 each, more than Instagram Stories pays and more than Facebook's feed carousel, though Instagram Reels pays more still. The floor placement is not the worst place to stand. Almost nobody in this cohort is standing on it with enough budget to matter.
The organic mirror
The same vertical's organic Instagram footprint carries the same fingerprint. Across 20 brands and 221 posts in the same 90-day window, engagement rate comes back identical at the 25th, 50th, and 75th percentiles, views per post are stuck at the same figure across the distribution, and the median brand published just 7 posts in three months [3]. It is the shape of placeholder accounts rather than performing ones. When the paid side runs one-off €2.78 tests and the organic side posts on a dribble, neither ledger can teach the other anything.
What to do Monday
- Join spend to reach yourself, per ad, before trusting either field. Flag any implied CPM under €1 for manual audit. In this cohort that flag fires almost everywhere.
- Consolidate accounts. At 5.8 accounts per brand, frequency, audience, and creative learning never accumulate. Seven ads in one account, which is roughly what the average brand here ran all quarter, beats one ad in each of seven accounts every time.
- Backfill format metadata. "Unknown" on 100% of rows makes every benchmark join worthless and every format comparison a fiction.
- If you compete in this vertical, the bar is on the floor. One sustained awareness ad with a labeled format and a real budget would out-measure 99 accounts of coin flips before lunch.
The dashboards say these ads reached people. The arithmetic says the money was never there. When reach shows up without a price attached, that is not efficiency. It is missing fields wearing an efficiency costume.
Keep Reading
Start with one monitor. Free.
Add a brand, paste a couple of competitor handles, and see your first calibrated readout in under five minutes.