The €11.45 Post: What Italian Automotive's Organic TikTok Grind Is Actually Worth
Thirty-four Italian car brands published 7,859 TikToks in 90 days for a median 2,862 views each. Priced against Italy's €4 TikTok in-feed CPM, the typical post is worth about €11.45. The real money is in shares, not views.
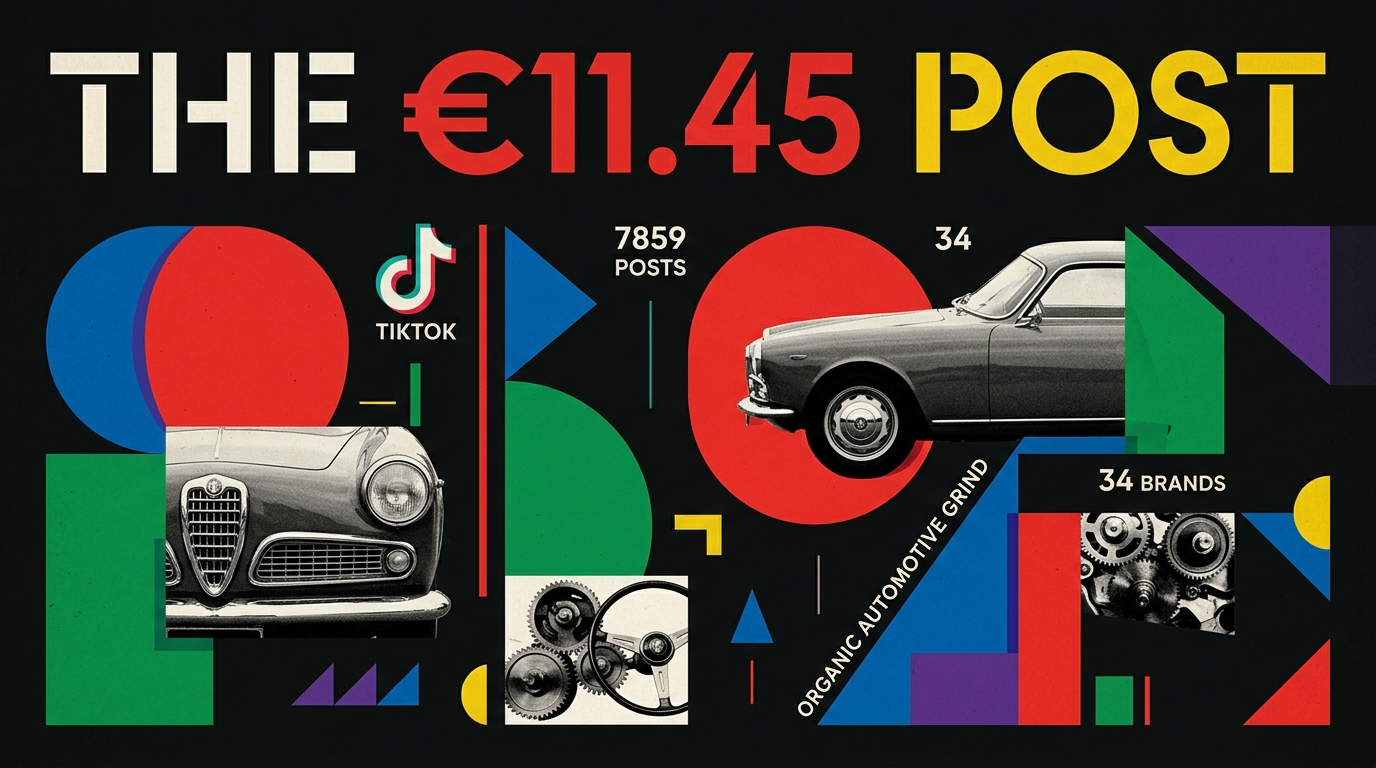
Italian car marketing on TikTok is an organic operation. In the 90 days ending September 16, 2026, 34 automotive brands published 7,859 posts on the platform in Italy, and the shape of that output says a lot about how the industry thinks short-form video works: publish constantly, let the algorithm sort it out, and treat paid distribution as someone else's problem.
The cadence: a post every other day, minimum
The median brand in this cohort put out 48 posts in 90 days, roughly one every 1.9 days. That is not a campaign. That is a conveyor belt. Automotive is a considered purchase with long replacement cycles, yet the content strategy looks like a daily publisher's, which suggests brands have internalized TikTok's core bargain: the feed rewards volume and recurrence more than polish and planning.
What a post actually earns
Here is the performance ladder for a single post, across all 7,859 in the window:
| Percentile | Views per post | Interactions per post | Engagement rate |
|---|---|---|---|
| p25, the floor | 851 | 29 | 1.77% |
| p50, the typical post | 2,862 | 94 | 3.36% |
| p75, a minor hit | 16,000 | 509 | 7.06% |
Two things stand out.
First, the spread is violent. A top-quartile post pulls nearly 19 times the views of a bottom-quartile post and about 5.6 times the views of the median. The engagement-rate range, 1.77% to 7.06%, is a fourfold gap. This is a hit-driven format where the median is a liar: half of everything the industry publishes lands under 2,862 views, and a meaningful chunk lands under a thousand.
Second, the engagement math is internally consistent and genuinely strong. 94 interactions on 2,862 views works out to about 3.3%, matching the 3.36% median per-post rate. For context, anything above 3% on a reach-weighted basis is the kind of number social teams screenshot for their QBR decks.
Pricing the grind
Now the fun part: what would this cost to buy?
Italy's benchmark for TikTok in-feed video sits at a €4.00 CPM, per the public-consensus estimate from May 2026. Treat that as the sticker price for a thousand paid impressions on the same surface these brands are working organically, and the organic output converts into media value like this:
| Post tier | Views | Paid equivalent at €4.00 CPM |
|---|---|---|
| p25 | 851 | €3.40 |
| p50 | 2,862 | €11.45 |
| p75 | 16,000 | €64.00 |
The typical Italian auto TikTok post earns about €11.45 of reach. A median brand's full quarter of posting, 48 posts at median performance, adds up to roughly 137,000 views, or about €550 of equivalent paid media. Scale that (conservatively, using the median post across a right-skewed distribution) to the whole cohort and the industry's 90-day organic output clears €89,000 in equivalent reach.
The honest framing: organic views and paid in-feed impressions are not the same product. Paid comes with targeting, frequency control, and guaranteed delivery. Organic comes with none of that, but it also comes with social proof attached. Treat the euro figures as a yardstick, not an invoice.
Where the value actually sits
The benchmark row does something else interesting: it prices engagement, not just impressions. A view is valued at €0.005, suspiciously close to the €0.004 per-view cost implied by the CPM. Views, in other words, roughly pay for themselves. The margin is elsewhere:
- A share is valued at €1.00, equivalent to about 250 paid views
- A comment at €0.40, about 100 paid views
- A save at €0.30, about 75 paid views
- A bare reaction at €0.05
Run that against the median post's 94 interactions. If every single one were a low-value reaction, the engagement layer alone is worth €4.70, more than a third of the post's €11.45 reach value. Any real mix with shares and comments in it flips the economics: the interactions become worth more than the views that generated them.
This is the signal dashboards miss. A brand optimizing for view count on TikTok Italy is optimizing for the component of value that breaks even. The brands earning their keep are the ones in that top engagement quartile, pulling 7% engagement rates, because shares and comments are where the platform's accounting gets generous.
Who is winning, who is absent
Within the cohort, the winners are statistical: the quartile of posts clearing 16,000 views and 509 interactions. At €64 of reach plus a fat engagement premium, those posts are doing the work of a modest paid flight, for free, repeatedly.
The absence worth noting is structural. An industry publishing one post every two days per brand is an industry that has decided organic TikTok is infrastructure, not experiment. At a €4.00 CPM, the paid alternative is not expensive, and the value weights say the platform practically gives views away. The open question for Italian auto marketers is not whether they can afford paid TikTok. It is whether their organic hit rate, one post in four clearing five figures, actually beats just buying the reach and spending the creative energy on the shares and comments that carry the real value.
Keep Reading
Start with one monitor. Free.
Add a brand, paste a couple of competitor handles, and see your first calibrated readout in under five minutes.